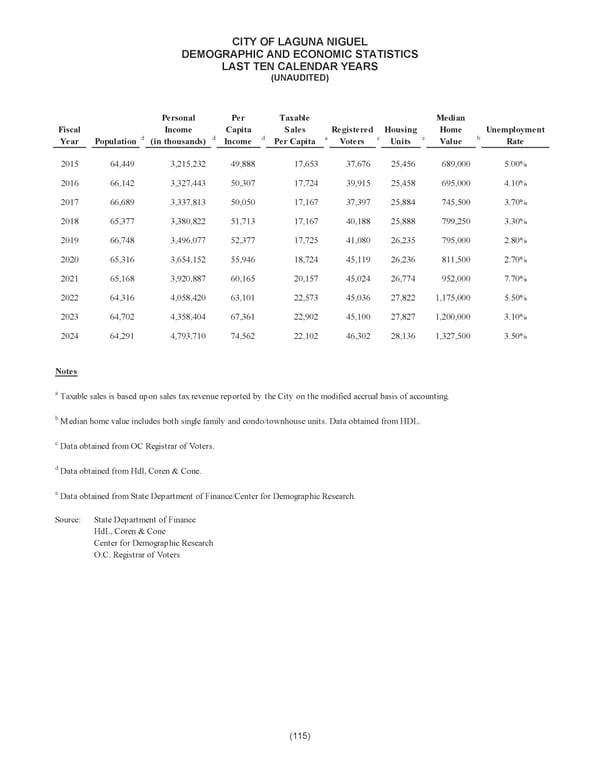
CITY OF LAGUNA NIGUEL DEMOGRAPHIC AND ECONOMIC STATISTICS LAST TEN CALENDAR YEARS (UNAUDITED) Personal Per Taxable Median Fiscal Income Capita Sales Registered Housing Home Unemployment Year Population d (in thousands) d Income d Per Capita a Voters c Units e Value b Rate 2015 64,449 3,215,232 49,888 17,653 37,676 25,456 689,000 5.00% 2016 66,142 3,327,443 50,307 17,724 39,915 25,458 695,000 4.10% 2017 66,689 3,337,813 50,050 17,167 37,397 25,884 745,500 3.70% 2018 65,377 3,380,822 51,713 17,167 40,188 25,888 799,250 3.30% 2019 66,748 3,496,077 52,377 17,725 41,080 26,235 795,000 2.80% 2020 65,316 3,654,152 55,946 18,724 45,119 26,236 811,500 2.70% 2021 65,168 3,920,887 60,165 20,157 45,024 26,774 952,000 7.70% 2022 64,316 4,058,420 63,101 22,573 45,036 27,822 1,175,000 5.50% 2023 64,702 4,358,404 67,361 22,902 45,100 27,827 1,200,000 3.10% 2024 64,291 4,793,710 74,562 22,102 46,302 28,136 1,327,500 3.50% Notes a Taxable sales is based upon sales tax revenue reported by the City on the modified accrual basis of accounting. b Median home value includes both single family and condo/townhouse units. Data obtained from HDL. c Data obtained from OC Registrar of Voters. d Data obtained from Hdl, Coren & Cone. e Data obtained from State Department of Finance/Center for Demographic Research. Source: State Department of Finance HdL, Coren & Cone Center for Demographic Research O.C. Registrar of Voters (115)
 City of Laguna Niguel Annual Comprehensive Financial Report 2024 Page 136 Page 138