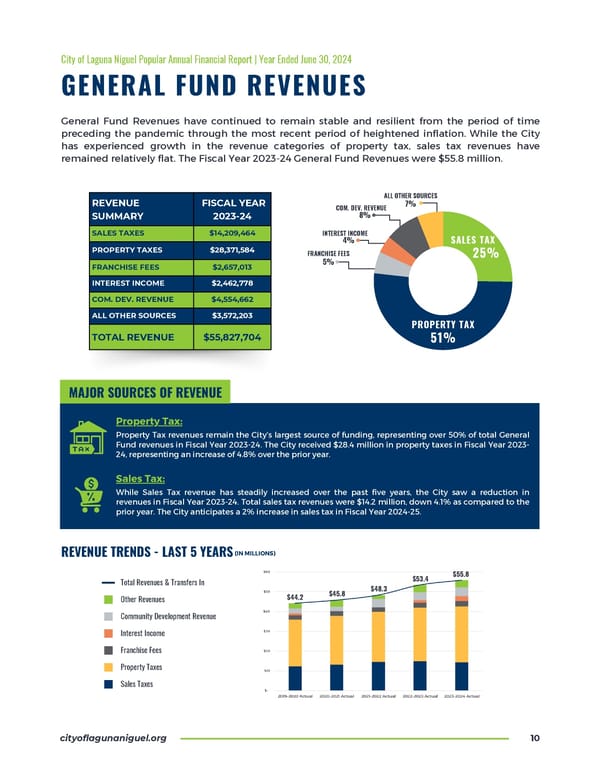
City of Laguna Niguel Popular Annual Financial Report | Year Ended June 30, 2024 GENERAL FUND REVENUES General Fund Revenues have continued to remain stable and resilient from the period of time preceding the pandemic through the most recent period of heightened inflation. While the City has experienced growth in the revenue categories of property tax, sales tax revenues have remained relatively flat. The Fiscal Year 2023-24 General Fund Revenues were $55.8 million. ALL OTHER SOURCES REVENUE FISCAL YEAR 7% COM. DEV. REVENUE 8% SUMMARY 2023-24 SALES TAXES $14,209,464 INTEREST INCOME 4% SALES TAX PROPERTY TAXES $28,371,584 FRANCHISE FEES 25% 5% FRANCHISE FEES $2,657,013 INTEREST INCOME $2,462,778 COM. DEV. REVENUE $4,554,662 ALL OTHER SOURCES $3,572,203 PROPERTY TAX TOTAL REVENUE $55,827,704 51% MAJOR SOURCES OF REVENUE Property Tax: Property Tax revenues remain the City’s largest source of funding, representing over 50% of total General Fund revenues in Fiscal Year 2023-24. The City received $28.4 million in property taxes in Fiscal Year 2023- 24, representing an increase of 4.8% over the prior year. Sales Tax: While Sales Tax revenue has steadily increased over the past five years, the City saw a reduction in revenues in Fiscal Year 2023-24. Total sales tax revenues were $14.2 million, down 4.1% as compared to the prior year. The City anticipates a 2% increase in sales tax in Fiscal Year 2024-25. (IN MILLIONS) REVENUE TRENDS - LAST 5 YEARS $55.8 $53.4 Total Revenues & Transfers In $48.3 $45.8 $44.2 Other Revenues Community Development Revenue Interest Income Franchise Fees Property Taxes Sales Taxes cityoflagunaniguel.org 10
 City of Laguna Niguel Popular Annual Financial Report 2024 Page 10 Page 12