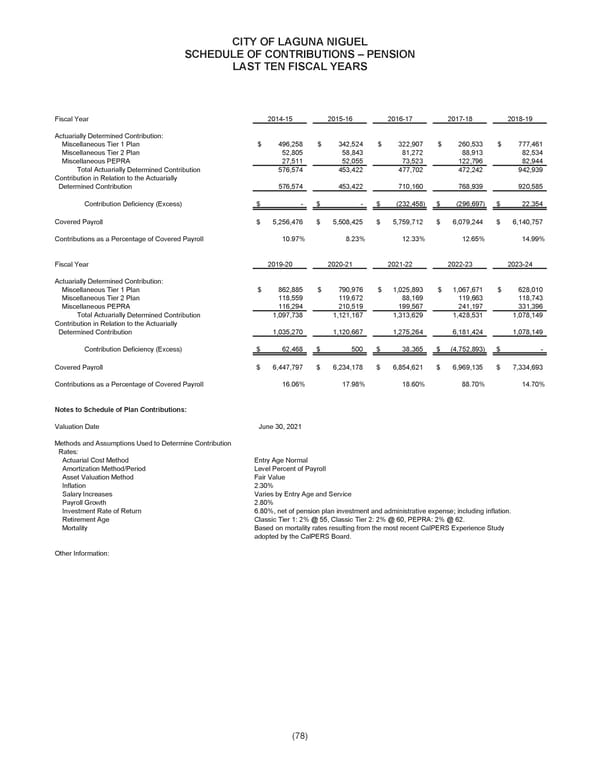
CITY OF LAGUNA NIGUEL SCHEDULE OF CONTRIBUTIONS – PENSION LAST TEN FISCAL YEARS Fiscal Year 2014-15 2015-16 2016-17 2017-18 2018-19 Actuarially Determined Contribution: Miscellaneous Tier 1 Plan $ 496,258 $ 342,524 $ 322,907 $ 260,533 $ 777,461 Miscellaneous Tier 2 Plan 52,805 81,27258,843 88,913 82,534 Miscellaneous PEPRA 27,511 52,055 73,523 122,796 82,944 Total Actuarially Determined Contribution 576,574 453,422 477,702 472,242 942,939 Contribution in Relation to the Actuarially Determined Contribution 576,574 453,422 710,160 768,939 920,585 Contribution Deficiency (Excess) $ - - $ (232,458) $ (296,697) $ 22,354 $ Covered Payroll $ 5,256,476 $ 5,508,425 $ 5,759,712 $ 6,079,244 $ 6,140,757 Contributions as a Percentage of Covered Payroll 10.97% 8.23% 12.33% 12.65% 14.99% Fiscal Year 2019-20 2020-21 2021-22 2022-23 2023-24 Actuarially Determined Contribution: Miscellaneous Tier 1 Plan $ 862,885 $ 790,976 $ 1,025,893 $ 1,067,671 $ 628,010 Miscellaneous Tier 2 Plan 118,559 119,672 88,169 119,663 118,743 Miscellaneous PEPRA 116,294 210,519 199,567 241,197 331,396 Total Actuarially Determined Contribution 1,097,738 1,121,167 1,313,629 1,428,531 1,078,149 Contribution in Relation to the Actuarially Determined Contribution 1,035,270 1,120,667 1,275,264 6,181,424 1,078,149 Contribution Deficiency (Excess) $ 62,468 $ 500 $ 38,365 $ (4,752,893) $ - Covered Payroll $ 6,447,797 $ 6,234,178 $ 6,854,621 $ 6,969,135 $ 7,334,693 Contributions as a Percentage of Covered Payroll 16.06% 17.98% 18.60% 88.70% 14.70% Notes to Schedule of Plan Contributions: Valuation Date June 30, 2021 Methods and Assumptions Used to Determine Contribution Rates: Actuarial Cost Method Entry Age Normal Amortization Method/Period Level Percent of Payroll Asset Valuation Method Fair Value Inflation 2.30% Salary Increases Varies by Entry Age and Service Payroll Growth 2.80% Investment Rate of Return 6.80%, net of pension plan investment and administrative expense; including inflation. Retirement Age Classic Tier 1: 2% @ 55, Classic Tier 2: 2% @ 60, PEPRA: 2% @ 62. Mortalit y Based on mortality rates resulting from the most recent CalPERS Experience Study adopted by the CalPERS Board. Other Information: (78)
 City of Laguna Niguel Annual Comprehensive Financial Report 2024 Page 99 Page 101