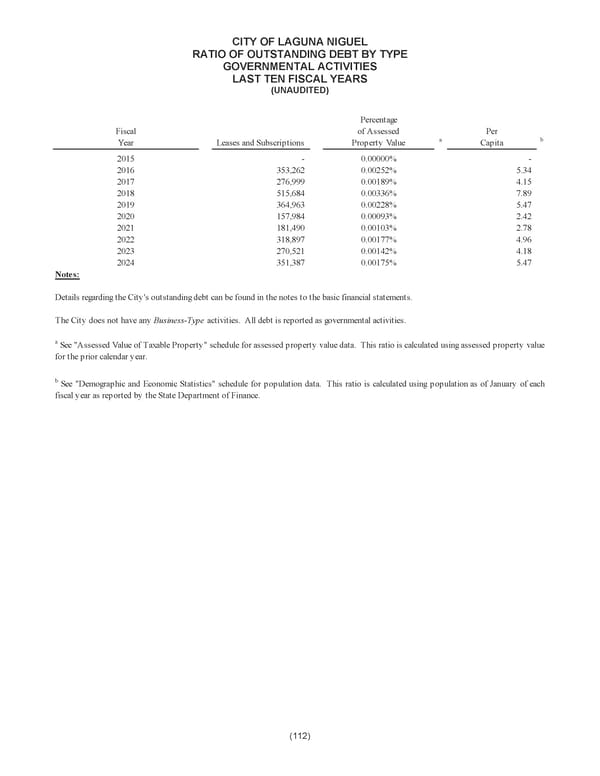
CITY OF LAGUNA NIGUEL RATIO OF OUTSTANDING DEBT BY TYPE GOVERNMENTAL ACTIVITIES LAST TEN FISCAL YEARS (UNAUDITED) Percentage Fiscal of Assessed Per Year Leases and Subscriptions Property Value a Capita b 2015 0- .00000% - 2016 353,262 0.00252% 5.34 2017 276,999 0.00189% 4.15 2018 515,684 0.00336% 7.89 2019 364,963 0.00228% 5.47 2020 157,984 0.00093% 2.42 2021 181,490 0.00103% 2.78 2022 318,897 0.00177% 4.96 2023 270,521 0.00142% 4.18 2024 351,387 0.00175% 5.47 Notes: Details regarding the City's outstanding debt can be found in the notes to the basic financial statements. The City does not have any Business-Type activities. All debt is reported as governmental activities. a See "Assessed Value of Taxable Property" schedule for assessed property value data. This ratio is calculated using assessed property value for the prior calendar year. b See "Demographic and Economic Statistics" schedule for population data. This ratio is calculated using population as of January of each fiscal year as reported by the State Department of Finance. (112)
 City of Laguna Niguel Annual Comprehensive Financial Report 2024 Page 133 Page 135